Occasionally, to troubleshoot some performance or network related issues it may be necessary to collect a wide range of logs with information about system and network performance. These are not NewNet Lithium logs, but logs pertaining to the server itself.
We have created these scripts to collect extensive performance logs of the server, in the LoggingScript.zip file. Here are instructions on how to use them:
- Extract the two scripts: start_sar_logging.sh and stop_sar_logging+compress_logs.sh to the server.
- Run the command
chmod +x start_sar_logging.sh stop_sar_logging+compress_logs.shto enable execution of the scripts. - Run the script start_sar_logging.sh. This will start sar logging to specific output files that will be collected later.
- Wait roughly 1 hour, being sure to capture the issue occurring.
- Once you are confident that the issue has occurred while the logging is running, please run stop_sar_logging+compress_logs.sh.
- This will both stop the extensive sar logging, but also compress all of the generated output files into one file, with a name like: sar_logs_20250617_090048.tar.gz
- Finally, please share the generated compressed log bundle with Support.
- If the log bundle is under 50 MB, you can attach it directly to the support ticket.
- If the log bundle is over 50 MB, please inform Support so that an SFTP location can be prepared for you to upload the logs.
This should generate roughly 16 MB or logs per hour, so it will not consume massive amounts of storage, but it should be deactivated using the stop_sar_logging+compress_logs.sh script when complete or no longer needed.
<supportagent>
Once we get the sar_log_* folder from the customer:
- Extract the sar_log_*.gz file to a directory.
- Download and extract the convert_all_logs.zip file to the directory containing the logs from the customer (you should see convert_all_logs.py, analyze_resource_usage.py, and a directory called converter_scripts).
- Run the convert_all_logs.py script.
- A folder called CSV will be created with CSV versions of all the logs they provided.
Once we have the CSV files, we can analyze them by simply running analyze_resource_usage.py in the same directory. it should return something like this if there is high resource usage or network congestion:
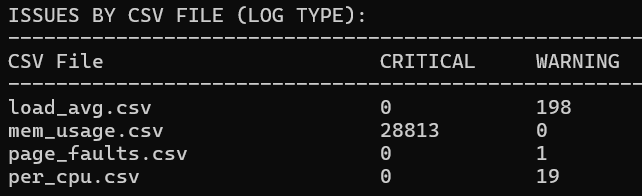
And it will output all suspect lines to a file called resrouce_usage_issues.txt so that you can investigate further. In this example, we would next load the mem_usage.csv file in Excel to investigate the pattern of high memory usage.
</supportagent>
Matthew Mrosko
Comments