Overview
When you look at the routing rules statistics (Statistics>Rule>Routing Rules>MO), you notice some spikes in the chart.
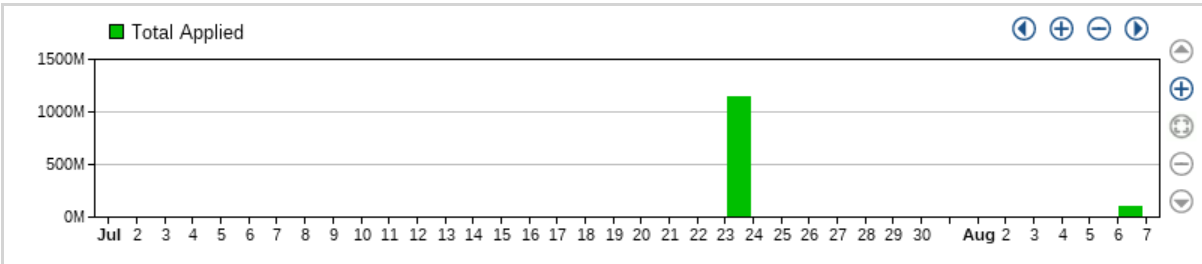
When you look at the log for a single rule at the time of the spike, it shows a number way lower than in the chart. It seems like the statistics have been miscalculated, or there is another issue with them.
You may also note a discrepancy when comparing the statistics of two consecutive months, with a big difference between them. Example:
| Month | Total MO/Throughput | Total MT/Throughput |
| July | 41,539,149 | 497,308,092 |
| August | 139,485,239 | 1,883,797,129 |
Information
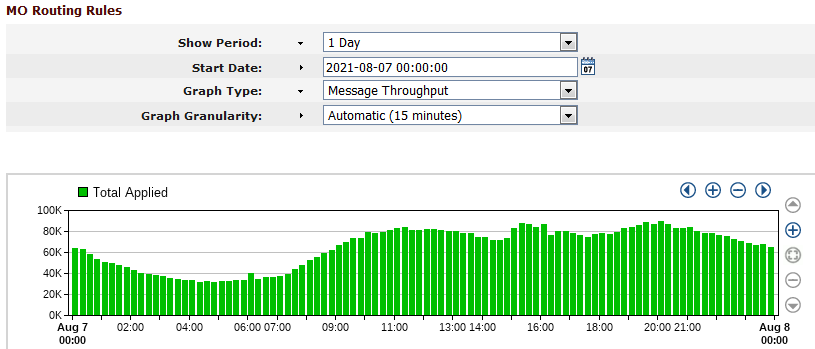
Looking at the chart for a typical day, it is possible to determine the rough average number of messages every 15 minutes. In the chart below, we can notice that the average traffic is around 80,000.
A real spike could be something like five times the average, but the spike at the troubled chart is hundreds or thousands of times bigger than the average. That indicates that that number is not actual.
If there is also a big difference in the monthly numbers between two consecutive months and there is no business explanation for that, it may be an indicator that those numbers are wrong.
How The Statistics Are Calculated
Several counters are calculated for different processes (RTR, HUB, FAF, AMS, etc...). The traffic servers generate statistic files every 5 minutes containing the value of the counters at that moment.
The counters are always incremented. For example, at X time, RTR1 has the MOR id1 = 250, MOR id2 = 125, and so on. Five minutes later, the counters will be MOR id1 = 275, MOR id2 = 131, and so on. The statistics system calculates the difference between the newer and the older values. That means that, in the last five minutes, RTR1 received 25 messages on MOR id1 (275-250=25), 6 messages on MOR id2 (131-125=6). By calculating all counters and summing up the result of all nodes, it is possible to determine the total traffic on the network.
Situations That Generate Wrong Values
These are some scenarios where the value shown in the chart could be wrong:
- The process that generates the files with the STV counters for a node is stopped. It remains stopped for 10 days until someone notices that something is wrong with that node. When the process is restarted, it will collect the counters, but their values will be abnormally high (because 10 days have passed). In that case, there will be a spike due to the 10 days that were not considered previously. If the process is stopped in one month and resumed on the next month, the monthly numbers would be low in the first month (due to incomplete data) and high in the next month (since the numbers would include data from the previous month).
- There is a process restart in a node (e.g., RTR). That could happen due to a core dump, or it could have been manually restarted. The RTR counters will be restarted and will have their values reset. After 5 minutes, the counters will be, for example, MOR id1 = 22 and MOR id2 = 4. That could mess up the statistics. The STV considers the process uptime and detects it has been restarted. Based on that, it knows the counters were reset and applies the new values directly to the GUI.
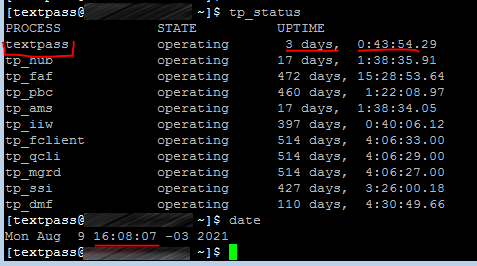
- The uptime counter is reset. A counter registers how many 1/100 seconds a process is in the Operating status. That counter has 32 bits and, therefore, has a maximum value of around 4 billion. When the maximum value is reached, it resets to 0. That occurs after around 497 days. The process has not been restarted, but the counter was reset. STV cannot detect this situation and considers that a restart happened. Thus, it uses the last counter value without subtracting the previously stored value, generating the spike on the chart. By running tp_status, it is possible to see the processes' uptime.
A small uptime in just one process may indicate the counter was reset. That can be confirmed by looking at the syslog to check if the process was restarted. The difference between date and uptime will probably coincide with the spike time on the chart.
The third situation can be prevented by creating a cron job that restarts all the processes in all servers once a year (the processes must not be restarted simultaneously but within small intervals). If you would like to have that job created, contact your Operations team requesting that (you can involve the Support team for further explanations, if needed).
Conclusion
If the spike is wrong based on the explanation above, you can disregard it since it does not indicate an issue.
If there was an issue that impacted the monthly numbers, these should also be disregarded. You must compare two months only if there were no incidents on them.
Priyanka Bhotika
Comments